
Welcome to StatPsyched, your platform for psychology research, statistics learning, workshops, and internships.
Internships, courses, workshops, & trainings
StatPsyched makes statistics & research simple with its internships, courses, trainings, and workshops. These opportunities are all exclusively tailored to make the world of research and statistics accessible & less daunting for students worldwide.

Statistical consulting services
Sometimes, all you need is someone who can guide you in the world of data, especially when you have a thesis or dissertation to complete! We are here to help.
Your Partner in Research and Publication
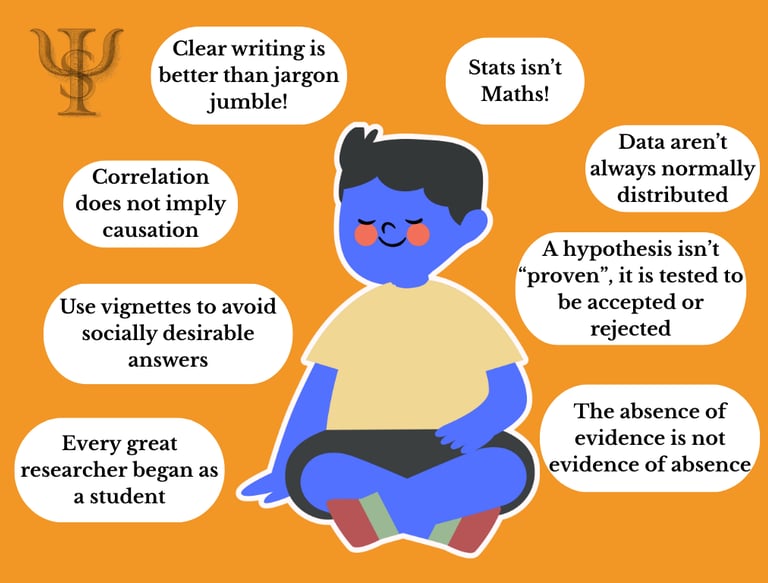
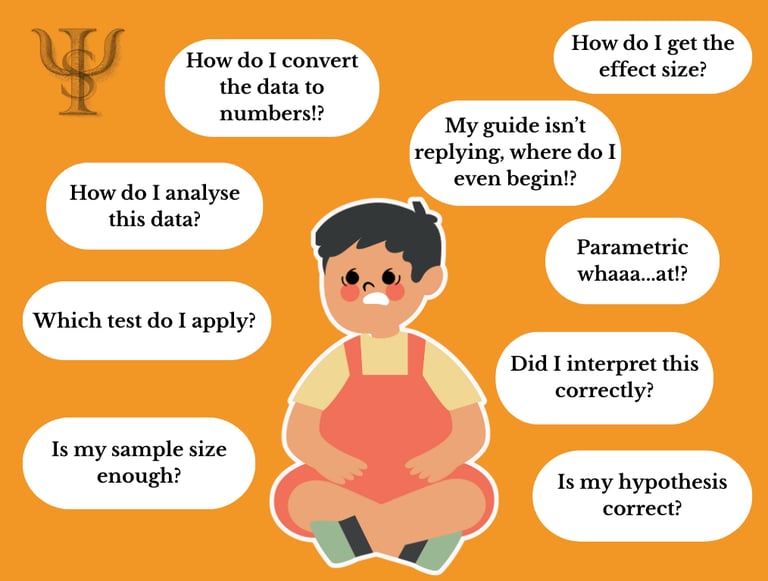
For psychology students who want to conquer their stats anxiety and publish their research.
Resources
A collection of a psychology student's bread & butter.


Our Publications
Our interns have co-authored publications in Springer Nature encyclopedias and international peer-reviewed journals.


Study abroad
Most consultants don't understand your path. We do. Specialized study abroad consulting for psychology students. Get expert guidance from someone who's been there.
StatPsyched has transformed my understanding of statistics! Their resources are incredibly accessible and have made learning enjoyable. Highly recommend for students everywhere!
Kashish T.

★★★★★
Welcome to StatPsyched, your trusted platform for psychology research & statistics learning.
Making statistics & research methodology accessible for students everywhere.
© 2025. All rights reserved.